If you’ve searched for “how to become a data analyst,” you’ve probably seen dozens of roadmaps filled with tools, programming languages, certifications, and conflicting advice.
One guide says learn Python first. Another says focus on SQL. Someone else claims AI will replace analysts altogether.
For beginners, it’s overwhelming.
After reviewing hundreds of job postings and observing how hiring expectations have evolved, one thing remains clear: companies aren’t hiring people because they know the most tools. They’re hiring people who can solve problems with data.
That’s the purpose of this guide.
Whether you’re a student, career changer, recent graduate, or working professional looking to enter tech, this Data Analyst Roadmap 2026 will help you understand what skills matter, what can wait, and how to build a portfolio that gets noticed.
Table of Contents
- Why Data Analytics Remains a Strong Career Choice
- What Data Analysts Actually Do
- The Modern Data Analytics Skill Stack
- Step 1: Learn How Data Works
- Step 2: Become Comfortable with Excel
- Step 3: Learn SQL
- Step 4: Add Python to Your Toolkit
- Step 5: Learn Data Visualization
- Step 6: Understand Basic Statistics
- Step 7: Use AI as a Productivity Tool
- Step 8: Build Real Projects
- Step 9: Create a Portfolio Recruiters Want to See
- Step 10: Prepare for Interviews
- Common Mistakes New Analysts Make
- Frequently Asked Questions
- Final Takeaway
Why Data Analytics Remains a Strong Career Choice in 2026
Every company generates data.
Retail stores track purchases. Hospitals monitor patient outcomes. Streaming platforms analyze viewing habits. Banks evaluate customer behavior. Even small businesses rely on analytics to understand what is working and what isn’t.
What has changed in recent years is the volume of data available. Organizations now have more information than they can realistically interpret on their own.
That’s where analysts create value.
A good analyst doesn’t simply build charts. They help answer questions such as:
- Why are sales declining?
- Which marketing campaign performed best?
- Why are customers leaving?
- Which products generate the highest profit?
These insights influence real business decisions.
As artificial intelligence automates repetitive tasks, the demand for professionals who can interpret results and provide recommendations continues to grow.
What Does a Data Analyst Actually Do?
One of the biggest misconceptions about analytics is that the job revolves around coding.
In reality, much of the role involves problem-solving and communication.
A typical day may include:
- Collecting data from different sources
- Cleaning incomplete or inaccurate records
- Writing SQL queries
- Building dashboards
- Identifying trends
- Presenting findings to managers
For example, imagine an e-commerce company notices a drop in revenue.
The analyst investigates customer behavior and discovers that mobile users are abandoning their carts at a much higher rate than desktop users. After the website team fixes the issue, conversions improve.
The analyst didn’t just create a report.
They helped solve a business problem.
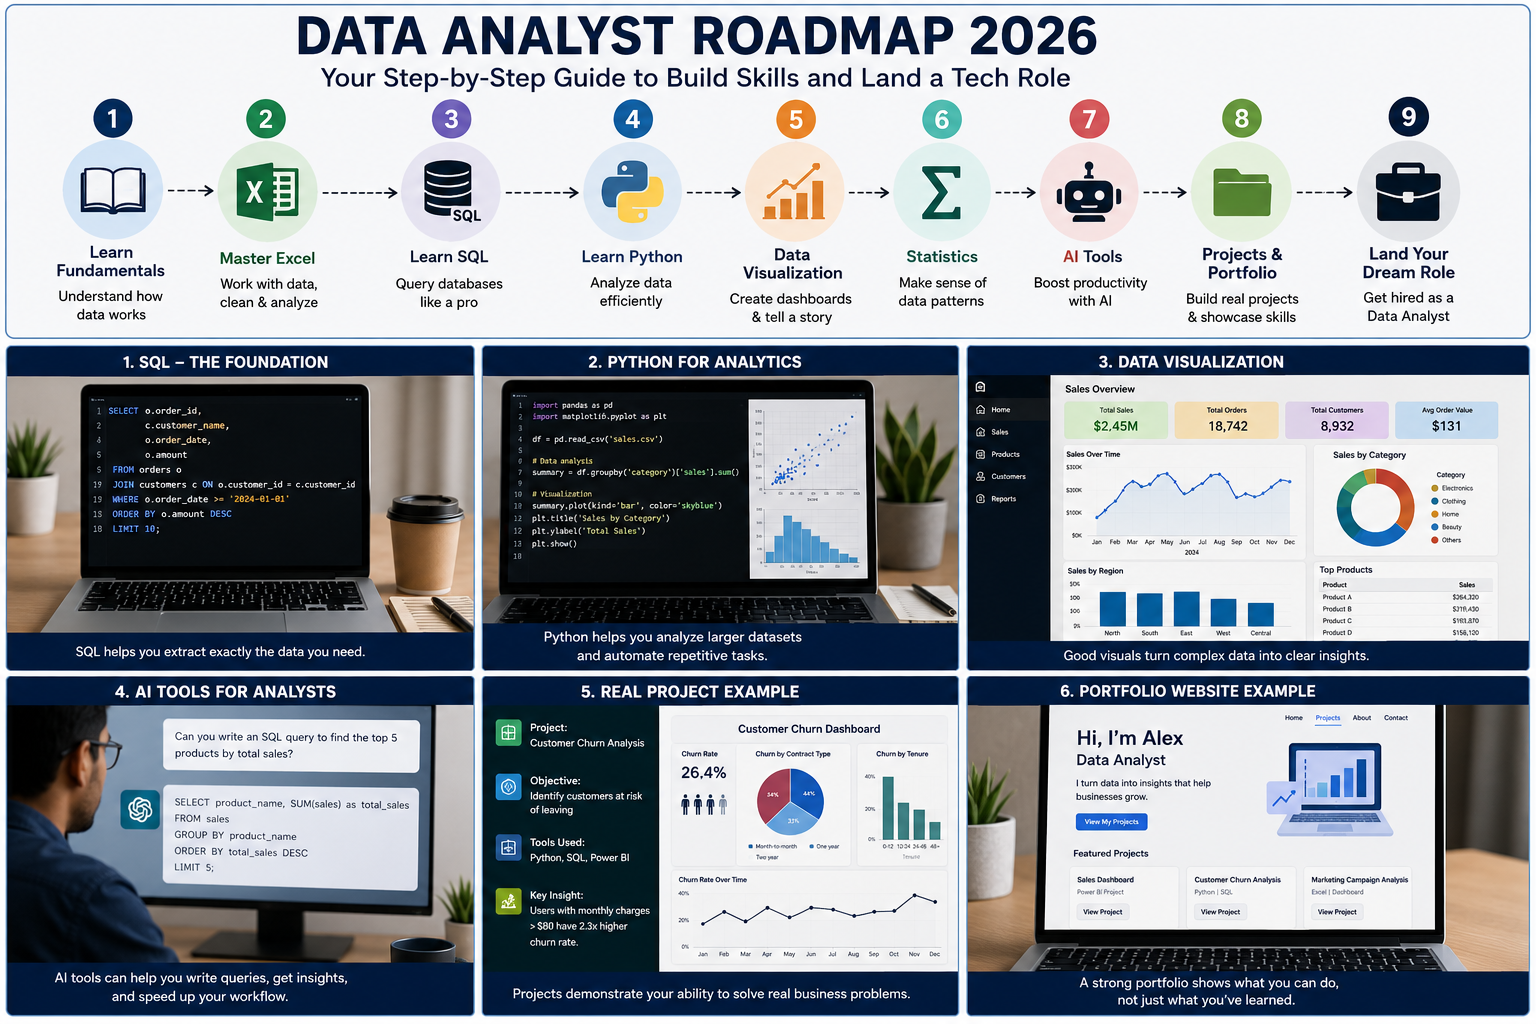
The Data Analytics Skill Stack for 2026
The most successful analysts develop skills across three areas.
Technical Skills
- Excel
- SQL
- Python
- Data Visualization
- Statistics
Business Skills
- Critical Thinking
- Communication
- Decision-Making
- Problem Solving
AI Skills
- Prompt Writing
- AI-Assisted Analysis
- Report Generation
- Workflow Automation
Many beginners focus entirely on technical tools.
Hiring managers often care just as much about whether you can explain your findings to non-technical people.
Step 1: Learn How Data Works
Before opening Python or SQL, learn the basics.
Understanding data structure will make every future skill easier to learn.
Focus on concepts such as:
- Rows and columns
- Databases
- Data types
- Missing values
- Data quality
- Data cleaning
Think of this stage as learning the rules of a language before trying to write essays.
Practice Exercise
Download a public dataset from Kaggle or a government website.
Try answering simple questions:
- Which category performs best?
- Which month generates the most revenue?
- Which products sell least frequently?
Learning to ask useful questions is one of the most underrated analytics skills.
Step 2: Become Comfortable with Excel
Many people assume Excel is outdated.
Employers disagree.
Even organizations with advanced analytics teams continue to use spreadsheets every day.
Skills Worth Learning
- Pivot Tables
- XLOOKUP
- Conditional Formatting
- Data Validation
- Charts and Graphs
- Data Cleaning Functions
Real-World Example
Suppose a manager sends you a spreadsheet containing 30,000 sales records and asks for a summary before a meeting.
An analyst who understands Pivot Tables can produce meaningful insights within minutes.
That’s real business value.
Step 3: Learn SQL Before Anything Else
If you only learn one technical skill this year, make it SQL.
Most business data lives inside databases, and SQL is how analysts access it.
In many entry-level roles, SQL is used more frequently than Python.
Core SQL Topics
- SELECT Statements
- Filtering Data
- Sorting Results
- Aggregations
- GROUP BY
- JOINS
- Subqueries
- Window Functions
Learning Tip
Don’t memorize commands.
Build small projects.
The fastest way to learn SQL is by solving practical business questions.
Step 4: Add Python to Your Toolkit
Many aspiring analysts worry because they don’t have a programming background.
That’s completely normal.
Some of the strongest analysts started in finance, marketing, operations, teaching, and customer service before learning Python.
The goal isn’t to become a software engineer.
The goal is to automate analysis and work with larger datasets.
Key Python Libraries
- Pandas
- NumPy
- Matplotlib
- Seaborn
- Scikit-Learn
A Practical Learning Order
- Excel
- SQL
- Python Basics
- Pandas
- Visualization
- Portfolio Projects
Trying to learn everything simultaneously usually leads to frustration.
Build skills layer by layer.
Step 5: Learn Data Visualization
Data is only useful when people can understand it.
A dashboard should help someone make a decision within seconds.
That’s why visualization is such an important skill.
Popular Tools in 2026
- Power BI
- Tableau
- Looker Studio
- Excel Dashboards
What Makes a Great Dashboard?
Good dashboards:
- Highlight key metrics
- Tell a clear story
- Reduce complexity
Poor dashboards:
- Contain too many charts
- Use unnecessary colors
- Hide important insights
Always prioritize clarity over design.
Step 6: Understand Basic Statistics
Statistics helps analysts separate meaningful patterns from random noise.
Fortunately, you don’t need advanced mathematics.
Focus on concepts you’ll actually use:
- Mean
- Median
- Mode
- Percentiles
- Standard Deviation
- Correlation
- Probability
Why This Matters
Imagine website traffic increases by 5%.
Should the company celebrate?
Not necessarily.
Statistics helps determine whether that increase reflects a genuine trend or ordinary variation.
Without statistical thinking, it’s easy to draw the wrong conclusions.
Step 7: Learn AI Tools for Data Analytics
The role of AI in analytics has expanded dramatically.
The best analysts aren’t competing against AI.
They’re using it to eliminate repetitive work.
Useful AI Tools for Data Analytics
ChatGPT
Useful for:
- Writing SQL queries
- Explaining code
- Brainstorming analyses
- Creating summaries
Microsoft Copilot
Particularly useful inside Excel and Power BI workflows.
Claude
Helpful for analyzing long reports and extracting insights.
Important Note
AI-generated outputs should always be reviewed.
Experienced analysts verify results before sharing recommendations with stakeholders.
Trust, accuracy, and accountability still matter.
Step 8: Build Projects That Solve Real Problems
Projects are often the deciding factor when recruiters compare candidates.
Certificates show you completed a course.
Projects show you can apply what you learned.
Strong Beginner Projects
Sales Performance Dashboard
Analyze:
- Revenue trends
- Top products
- Regional performance
Customer Churn Analysis
Identify:
- Why customers leave
- Risk factors
- Retention opportunities
Marketing Campaign Analysis
Measure:
- Conversion rates
- Cost per acquisition
- Return on investment
Choose projects connected to industries that interest you.
A healthcare project may attract healthcare employers. A finance project may appeal to financial organizations.
Step 9: Create a Portfolio Recruiters Want to See
Recruiters don’t want to see twenty unfinished projects.
They want evidence that you can think analytically.
Each project should answer four questions:
What Was the Problem?
Describe the business challenge.
What Data Did You Use?
Explain the source and quality of the data.
How Did You Analyze It?
Walk through your process.
What Did You Discover?
Present insights and recommendations.
This approach mirrors how analytics work happens inside real organizations.
Step 10: Prepare for Interviews
Most entry-level data analyst interviews focus on three areas.
Technical Knowledge
Expect questions about:
- SQL
- Excel
- Statistics
- Dashboards
Analytical Thinking
Interviewers may ask:
- How would you investigate declining sales?
- How would you measure customer retention?
- How would you evaluate a new product launch?
Communication
Many candidates can analyze data.
Far fewer can explain findings clearly.
Practice presenting your thought process aloud.
It often matters as much as the final answer.
Common Mistakes New Analysts Make
Learning Tools Instead of Solving Problems
Tools change.
Analytical thinking remains valuable.
Ignoring SQL
SQL continues to appear in the majority of analyst job descriptions.
Copying Portfolio Projects
Recruiters quickly recognize tutorials that have been copied without modification.
Neglecting Business Context
Companies hire analysts to improve outcomes, not simply create dashboards.
Depending Entirely on AI
AI can accelerate work, but understanding the underlying analysis remains essential.
Frequently Asked Questions
How long does it take to become a data analyst?
Most learners can develop job-ready skills within six to twelve months of consistent study and project work.
Can I become a data analyst without a coding background?
Yes. Many analysts begin with Excel and SQL before learning Python.
Is Python required?
Not always, but it significantly expands your opportunities and efficiency.
Which skill should I learn first?
Start with Excel and data fundamentals, then move to SQL.
Are AI tools replacing data analysts?
No. AI helps automate repetitive tasks, but organizations still need professionals who can interpret findings, validate results, and make recommendations.
Final Takeaway
The fastest route into analytics isn’t learning every new tool that appears on social media.
It’s building a strong foundation.
Start with data fundamentals. Learn Excel. Master SQL. Add Python. Understand visualization and statistics. Use AI wisely. Build projects. Create a portfolio.
Most importantly, focus on solving real problems.
Technology will continue to evolve, but businesses will always need people who can turn information into action.
That’s what great data analysts do—and that’s exactly the skill employers will continue to pay for in 2026 and beyond.